San Francisco Real Estate

January 2023 Report

San Francisco Real Estate January 2023 Report

2022 review of San Francisco real estate market statistics and economic indicators.

Text report summarizing the 2022 Bay Area housing market and 2023 outlook, with the Compass wordmark.

Chart of San Francisco house prices, 1993–2022, with historical market trends and annual median values.

San Francisco quarterly median house prices, 2012–2022; prices peak at $2 million in Q2 2022 before declining.

Chart of San Francisco median condo sale prices from 1993 to 2022, peaking in 2021 before a slight decline.

Chart of San Francisco quarterly median condo prices, 2012–2022, with Q4 2022 down about 12.5% year over year.

Chart comparing San Francisco condo and house median values per square foot from 2012 through December 2022.

San Francisco rolling home sales chart, with a green trend line peaking in 2021 before declining in 2022.

Chart of San Francisco monthly home sales from 2019–2022, showing seasonal patterns and a spring 2021 peak.

Chart of San Francisco higher-priced home sales by quarter, showing house and condo sales from 2018 to 2022.

Chart of 2022 San Francisco residential sales by property type, with condo sales exceeding house sales.

Chart compares annual median house sale prices from 2012–2022 across four San Francisco Realtor districts.

Bar chart comparing annual median San Francisco house sale prices across four realtor districts from 2012 to 2022.

Chart comparing annual median condo sale prices across five San Francisco districts from 2012 to 2022.

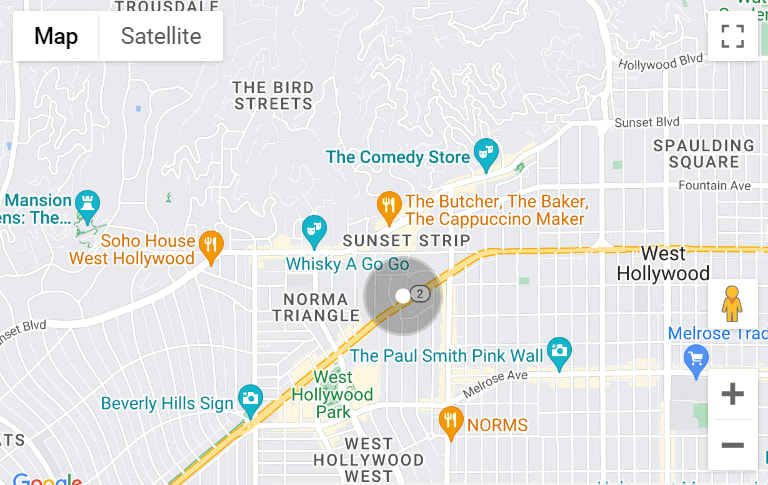
Map of San Francisco neighborhoods with a link to home prices based on second-half 2022 sales.

San Francisco quarterly absorption-rate chart, comparing houses with condos, co-ops and TICs from 2019 to 2022.

Chart comparing San Francisco house and condo sales over list price by quarter, 2018–2022.

Chart compares San Francisco house and condo sale prices against list prices by quarter, 2018–2022.

San Francisco quarterly days-on-market chart comparing houses and condos from 2019 through 2022.

Chart of U.S. 30-year mortgage rates from 1976 to January 2023, peaking above 18% in 1981.

Bar chart of S&P 500 January opening values from 1994 to 2022, highlighting market peaks, crashes, and the 2022 decline.

Chart of the Nasdaq Composite Index from 1995 to 2022, showing a 33.5% decline during 2022.

Chart of U.S. consumer price inflation from 1982 to 2022, with the three-month average rising sharply in 2022.

Line chart comparing unemployment rates across six Bay Area counties from 2019 to November 2022, with a sharp pandemic-era spike.

San Francisco Bay Area home-price report with a satellite map and table of median sale prices.

San Francisco skyline and Bay Bridge above a report teaser about the downtown condo market.

San Francisco Bay Area Real Estate Survey report graphic with the Golden Gate Bridge and Compass branding.

Pie chart of San Francisco house sales by price segment, August–November 2022, with sale counts and bedroom totals.

San Francisco housing sales by price segment, August–November 2022, shown in a labeled pie chart.

Bay Area large-house sales infographic comparing prices and property statistics across 11 counties, August–November 2022.

Bay Area county home-value table comparing prices, square footage, and price per square foot by bedroom and bath count.

Bay Area county home-value table comparing condo and townhouse prices, square footage, and price per square foot.

Chart of San Francisco housing by construction era, with the largest share built before 1940.

Chart of median San Francisco house size by construction era, ranging from 1,424 square feet for 1940–1959 homes to 2,957 for homes built since 2000.

Chart of San Francisco new listings, January 2018–November 2022, showing seasonal peaks and a September 2020 spike.

Bar chart showing San Francisco active home listings from January 2018 through November 2022.

Chart of monthly listing price reductions from 2018 to 2022, with October peaks and a pandemic-era spike.

San Francisco Bay Area home price appreciation report cover with a Golden Gate Bridge and regional landscape collage.

Real estate report notes on statistics, sales prices, square-foot calculations, and Compass disclaimers.

Work With Craig & Max

With nearly a decade of San Francisco real estate marketing experience, Craig & Max pair Craig’s deep San Francisco market knowledge and proven negotiating skills with Max’s strategic marketing and design expertise to guide San Francisco home buyers and San Francisco home sellers through every step of the process.
Contact Us